In July of 2024, I decided to try my hand at computer graphics art again. I have some experience with HTML Canvas and HTMLCanvasRenderingContext, so I was going to need to either build for the web, or learn computer graphics in a different language. It would have been a good idea to learn how to use GPU shaders or something, but I wanted to work with something that I already knew. Even so, I felt bad about using a CPU to render my art, so I went about looking for something that could not be parelizable at all. The first thing that came to mind was an algorithm based around depth/breadth first search.
I've already done some work with BFS, actually, and it had some pretty nice results.
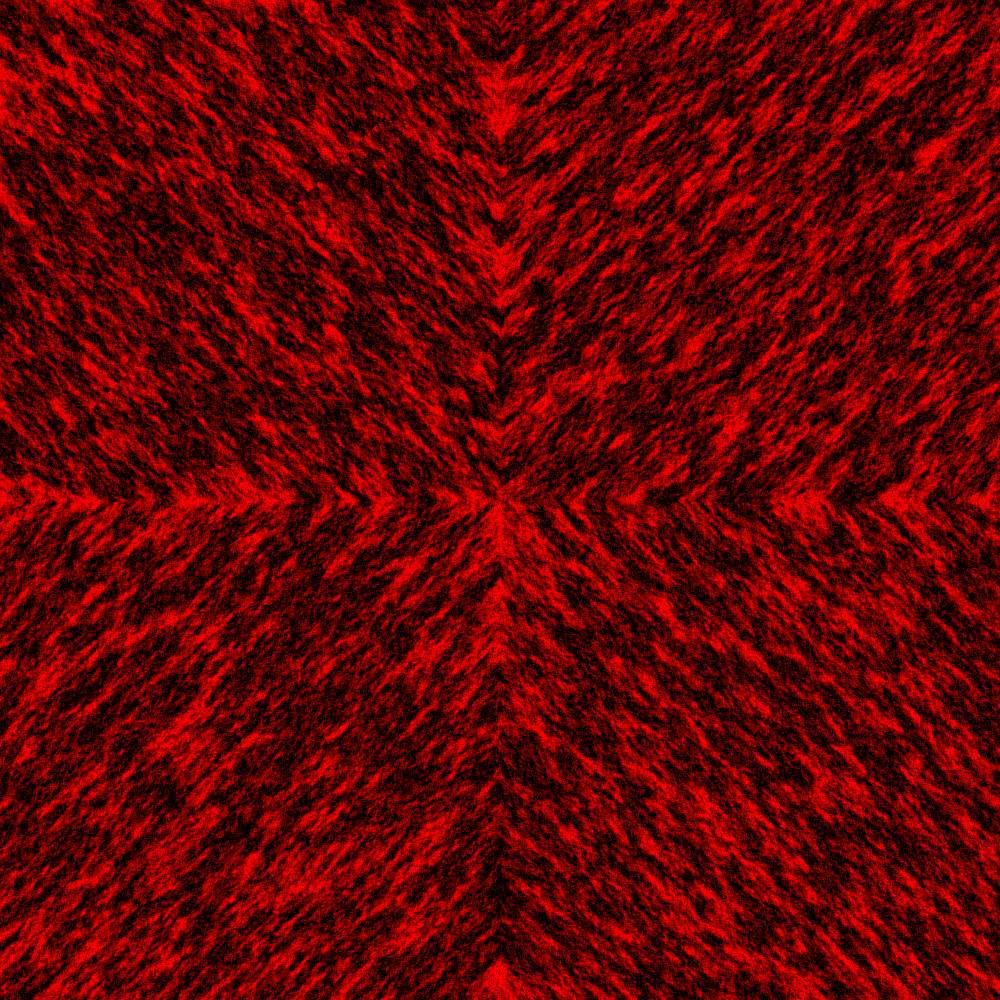
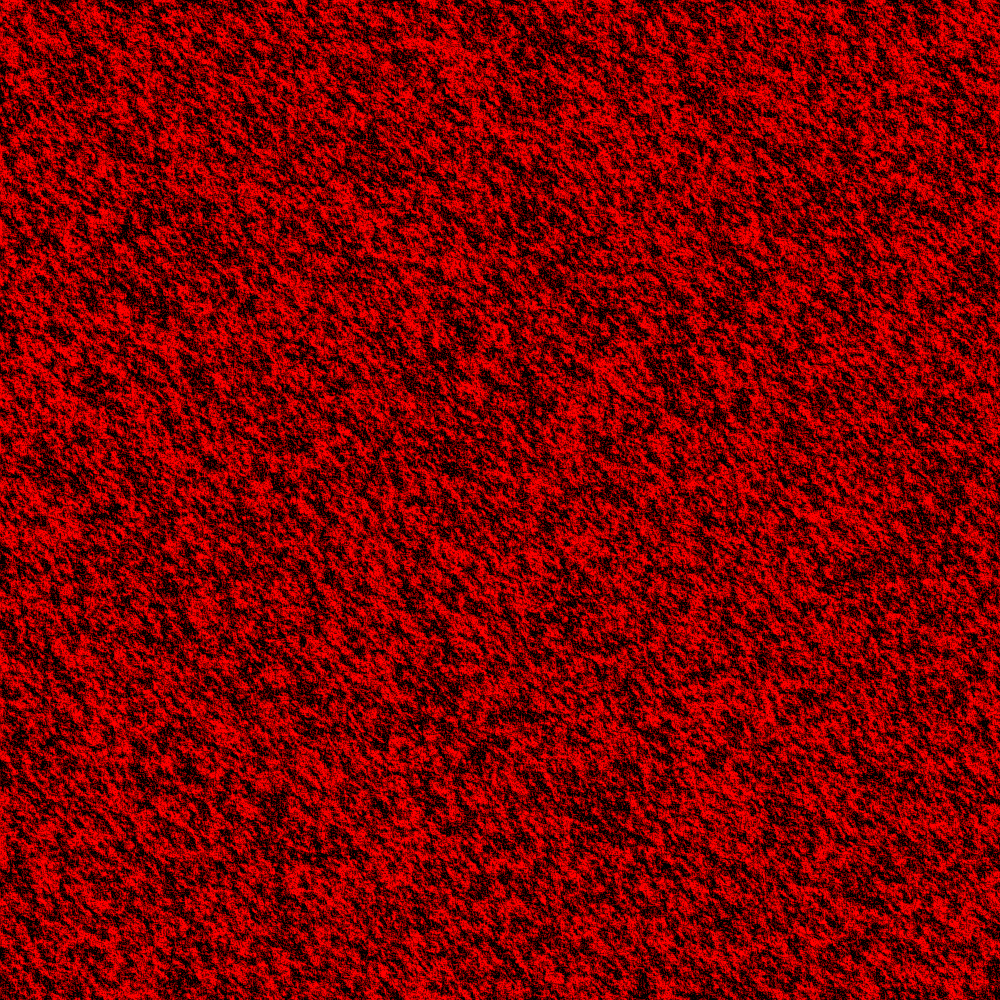
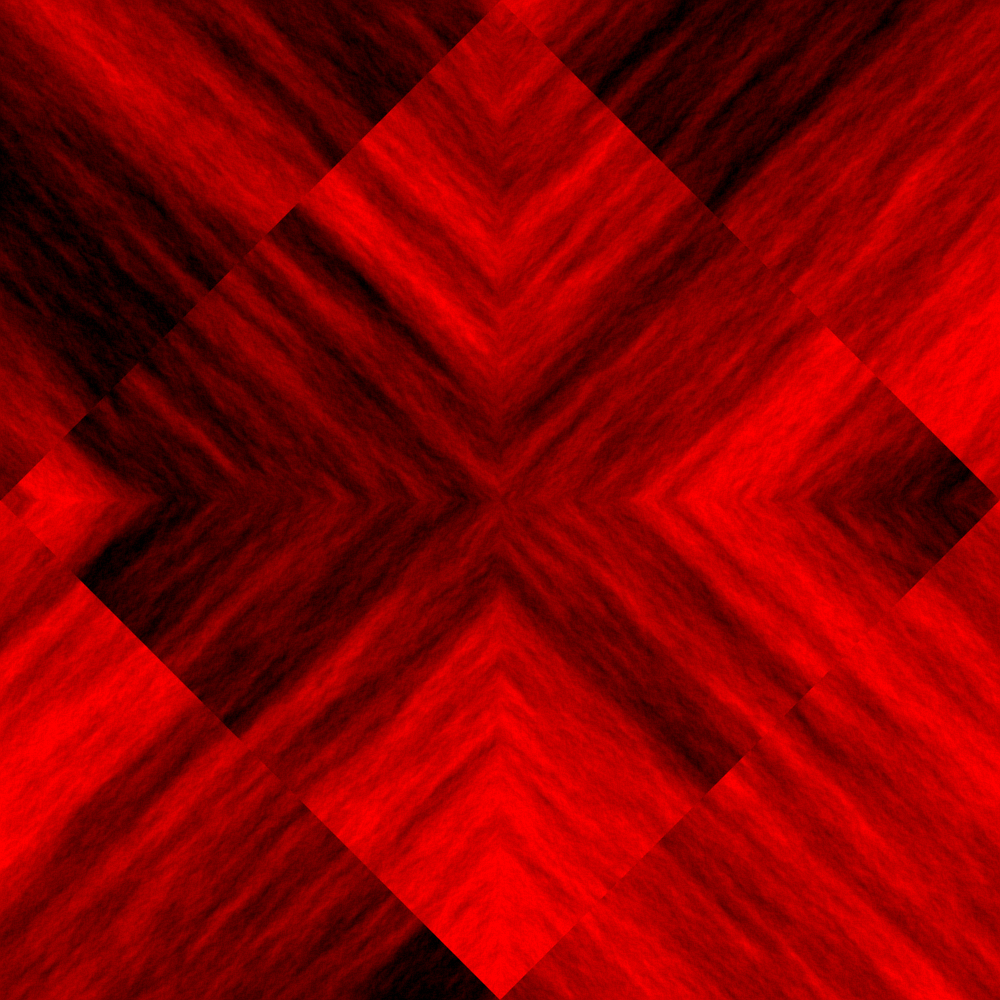
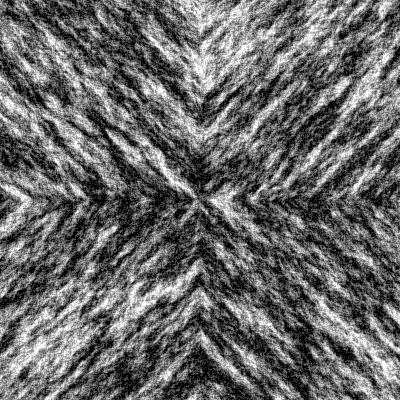
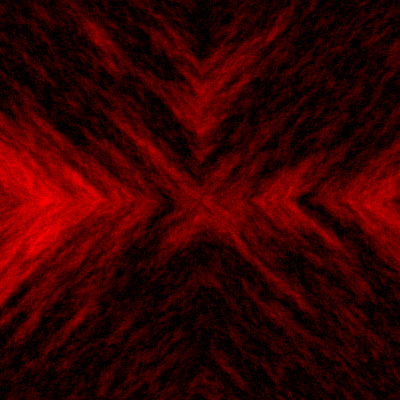
Depending on your experience with graph theory and BFS, you might understand what's happening in the above images. For those who don't, BFS is a essentially a way to make a computer explore a maze. Unlike a person,a computer doesn't intuitively understand what a maze is, so we have to define it in a way that is useful to it. One such way is a list of each of the cells in the maze, and each of the valid paths that can be taken from one cell to another. Fancy mathematiciens and computer scientists call the cells "nodes" and the valid paths "edges". They also call the collection of both of these a graph (hence the name). Back to BFS though, BFS is a very intuitive way to explore a graph. The computer starts with its start cell, finds the cells that are adjacent to it (if there are any), and then explores those cells. Once it does that, it finds next group of adjacent cells, and so on. For those who need a visual, if someone made a maze with raised walls, and then poured water into it, the water would generally follow the same BFS algorithm.
In the images I made, you can see the directionality of the algorithm. I started with multiple start points for these, usually in the center or edges.
At this point, you may be wondering how this algorithm makes color. Firstly, it represents each pixel as a node in a graph, and it defines the node's neigbors as the nodes that are adjacent to it. The algorithm just begins by setting it's start node with a random byte (0-255) value, and then for each cell that is visited after, the value is set based on byte values of the surrounding cells, and then sprinkling in a bit of randomness. Sadly I lost the code for the BFS art I made, so I can't add it here. Those byte values can be turned into the amount of red, green, and blue in each pixel.
So, Since I've already done BFS, I wanted to try out DFS/RDFS
RDFS stands for Randomized Depth First Search. It's a graph traversal algorithm similar to BFS, but with some significant changes. DFS attempts to go as far as it possibly can, before backtracking the minimum ammount, and then continuing to go as far as it can. DFS is less intuitive, but I've actually build a visual demo of RDFS which can show how it works. The difference between DFS and RDFS is that given a square graph, DFS will just select the first path available to go every time, so if you have the right node searched first in your algorighm, DFS will go in a straight line right as far a possible, and then if is searches down next, it will go straight down for as long as possible. RDFS is different in that it searches all of it's neigbors in a random order. I've never tried to generate a picture with plain DFS, but I've seen it traverse other square graphs, and they looked pretty bad.
Either way, with this terrible explaination out of the way, we can dive into the code. As I mentioned, I'm going to be building on the web, so I'll be writing code in Typescript.
First things first, I have some utility functions to clear up the algorithm itself. These are all pretty self explanitory, so I won't go into them. If you need, ChatGPT can prolly explain better than me anyways.
  function isVisited([x, y]: vec2, visited: boolean[]) {
    return visited[y * cw + x]
  }
  function setVisited([x, y]: vec2, visited: boolean[], wasVisited: boolean) {
    visited[y * cw + x] = wasVisited;
  }

  function isValid([x, y]: vec2) {
    return x >= 0 && x < cw && y >= 0 && y < ch;
  }

  function getNeighbors([x, y]: vec2) {
    return (<vec2[]>[
      //diagonal
      [x + 1, y + 1],
      [x + 1, y - 1],
      [x - 1, y + 1],
      [x - 1, y - 1],
      //straight
      [x - 1, y - 0],
      [x + 1, y - 0],
      [x - 0, y - 1],
      [x - 0, y + 1],
    ]).filter(isValid)
  }

  function getPointData(img: ImageData, [x, y]: vec2) {
    const start = ((y * cw) + x) * 4
    return <vec4>Array.from(img.data.slice(start, start + 4))
  }

  function setPointData(img: ImageData, [x, y]: vec2, ...[r = 0, g = 0, b = 0, a = 0]: vec4) {
    const i = (((y * cw) + x) * 4)
    img.data[i] = r;
    img.data[i + 1] = g;
    img.data[i + 2] = b;
    img.data[i + 3] = a;
  }
The First thing I need to do is allocate the memory and instantiate the objects I'm going to use.
  let numVisited = 0

  //set up required utility objects
  const visited: boolean[] = Array(cw * ch).fill(false)
  const img = ctx.createImageData(cw, ch)

  //setup que and start point
  const que: vec2[] = [[0, 0]]
  setPointData(img, [0, 1], 128, 0, 0, 255)
  setVisited([0, 1], visited, true)
The ctx.createImageData method creates something of a virtual canvas, that will allow us to set the color of each pixel, and export it as an image.
It's also worth mentioning that I create a visited array that will keep the algorithm from going through the same node multiple times.
Finally, I create a que array that will keep track of the cells I need to visit. I am going to use it as a stack, because it's my project, and I can name anything whatever the heck I want. I like to call all data structures que, because it's just 3 letters, and it sounds smarter than stack. Even babies can stack things, but I can't imagine a baby navigating a queue well.
With this done, we can get into the algorithm part of the algorithm.
  //iterate through que
  while (que.length) {
    const curr = <vec2>que.pop()
This first bit is pretty self explanitory. I pop the last item off the que, and set it as the current point.
    if (!isVisited(curr, visited)) {
      setVisited(curr, visited, true);
      numVisited++;
I check if the current point is visited. If it's not, I update the canvas, set the current point as visited, and increment the number of points visited.
      const neighbors = getNeighbors(curr)
      que.push(...shuffle(neighbors));
I find the neighbors of the current point, shuffle them, and then add them to the que. The shuffle is the R part of RDFS.
      const neighborPaints = neighbors
        .filter(val => isVisited(val, visited))
        .map(n => getPointData(img, n))
With these neigbors, I filter them to get rid of the visited ones, and map them to their colors.
      const avgPaint = vectorAvg(neighborPaints)
      const avgRed = avgPaint[0]
      setPointData(img, curr, mutate(avgRed, mutateRate, 0, 255), 0, 0, 255)
I average the colors, isolate the red component, and then set the color of the current point.
I also apply the mutate function here, Which will change the color of the pixel within the mutateRate, and clamp it between 0 and 255.
    }
  }
  console.log("done!")
  postMessage(<workerResponse>{
    completed: true,
    data: img
  })
When there is no more points in the que, we are done, and can export the image. You may notice that the postMessage function is used here which is not in the utility functions. This is because this algorithm is happening in a worker thread. MWAHAHAHA! I bet you thought That JS was a single threaded language, and that I was just going to freeze my host's computer on a big graph, but we weren't even on the main thread the whole time.
Regardless, at this point, the algorithm is done. I have a live demo up right now that you can try out for yourself. It has options to either render it locally (and asynchronously to avoid crashing) or using a webworker (which is much faster).
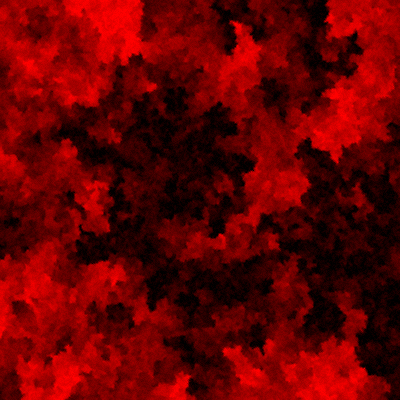
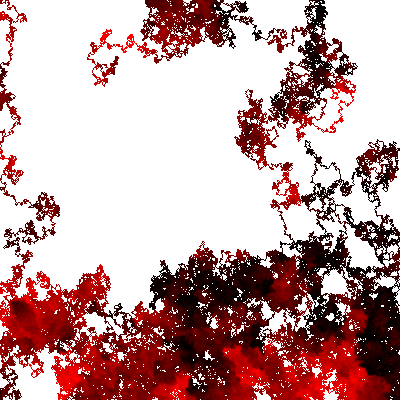
If you're too lazy to generate your own, however, I'll put a carousel here.
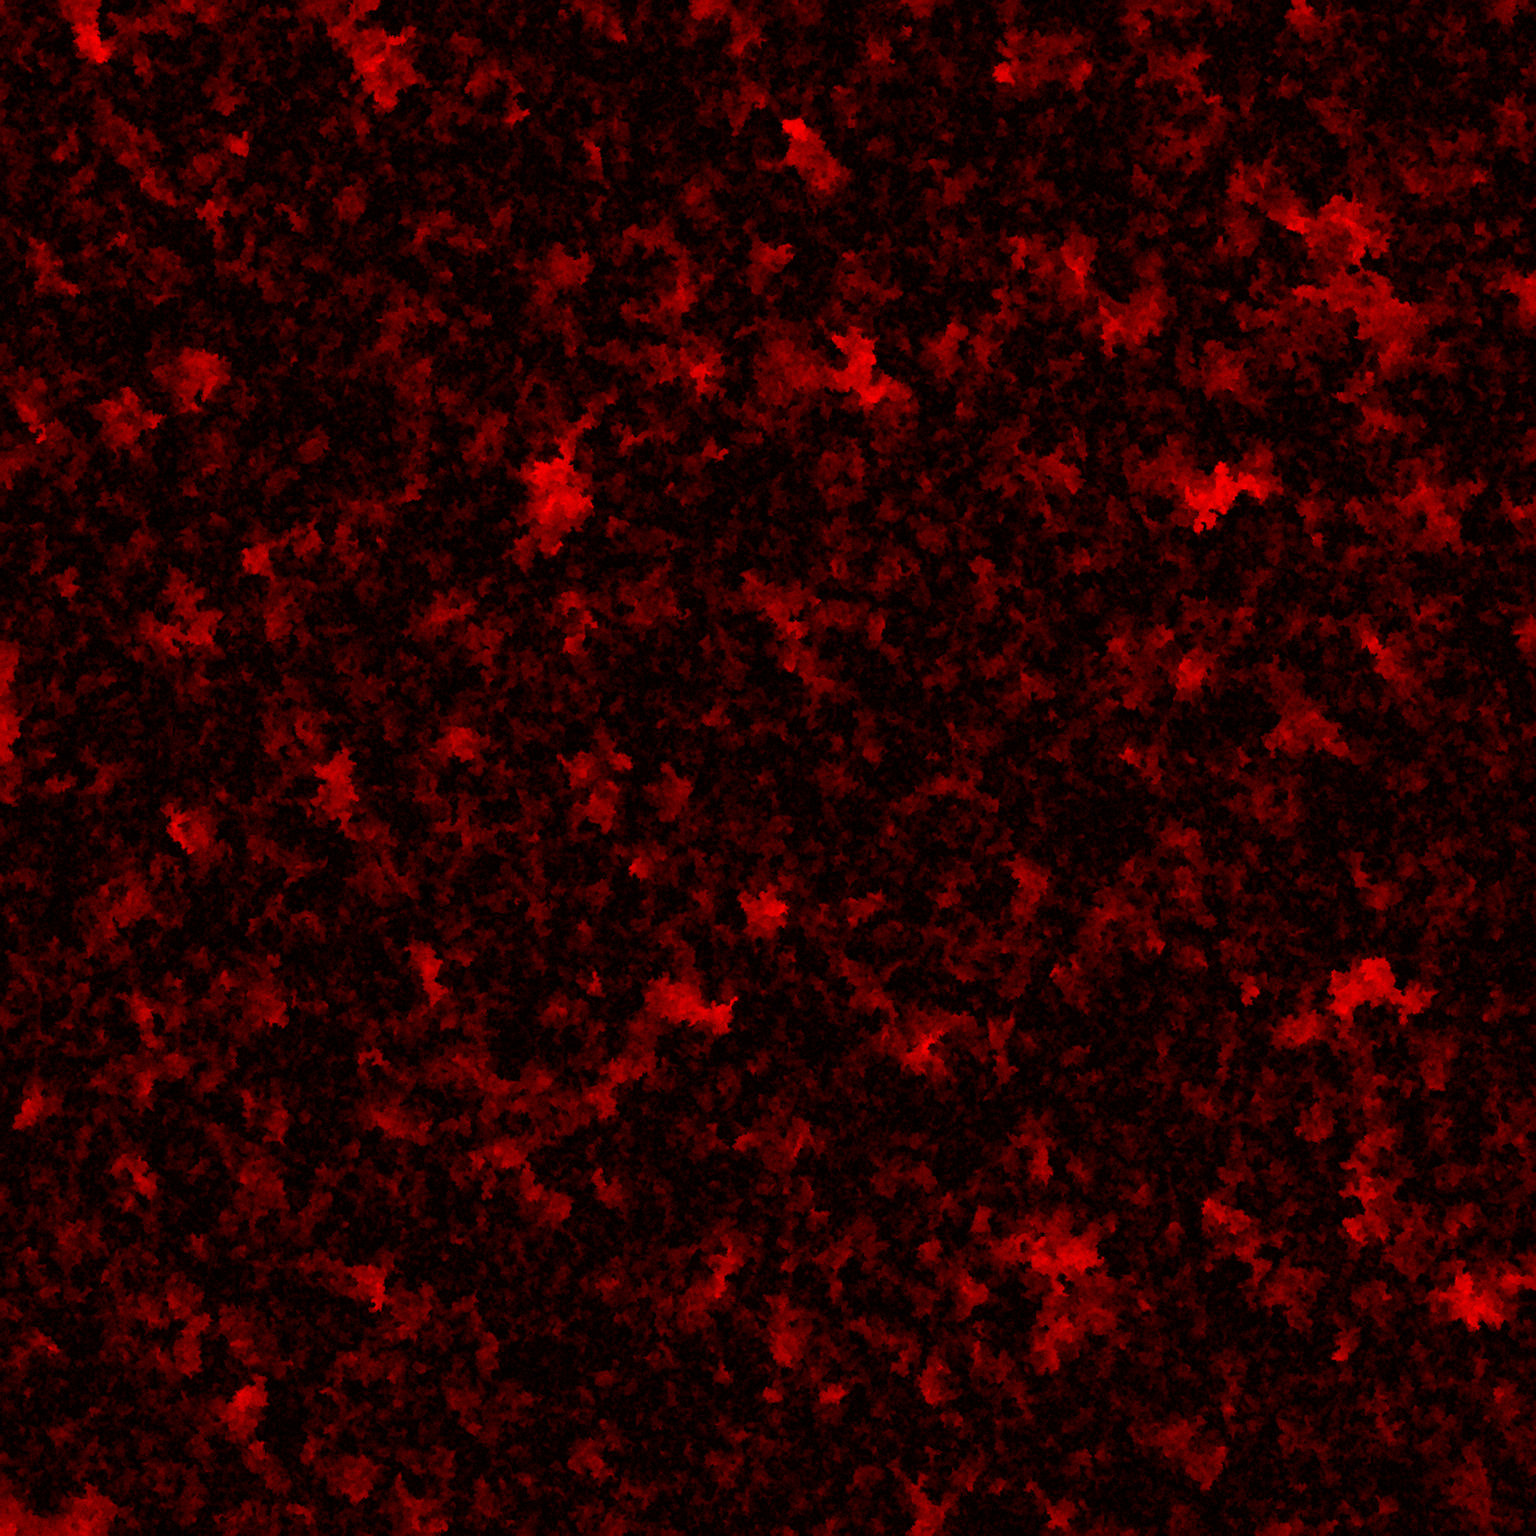
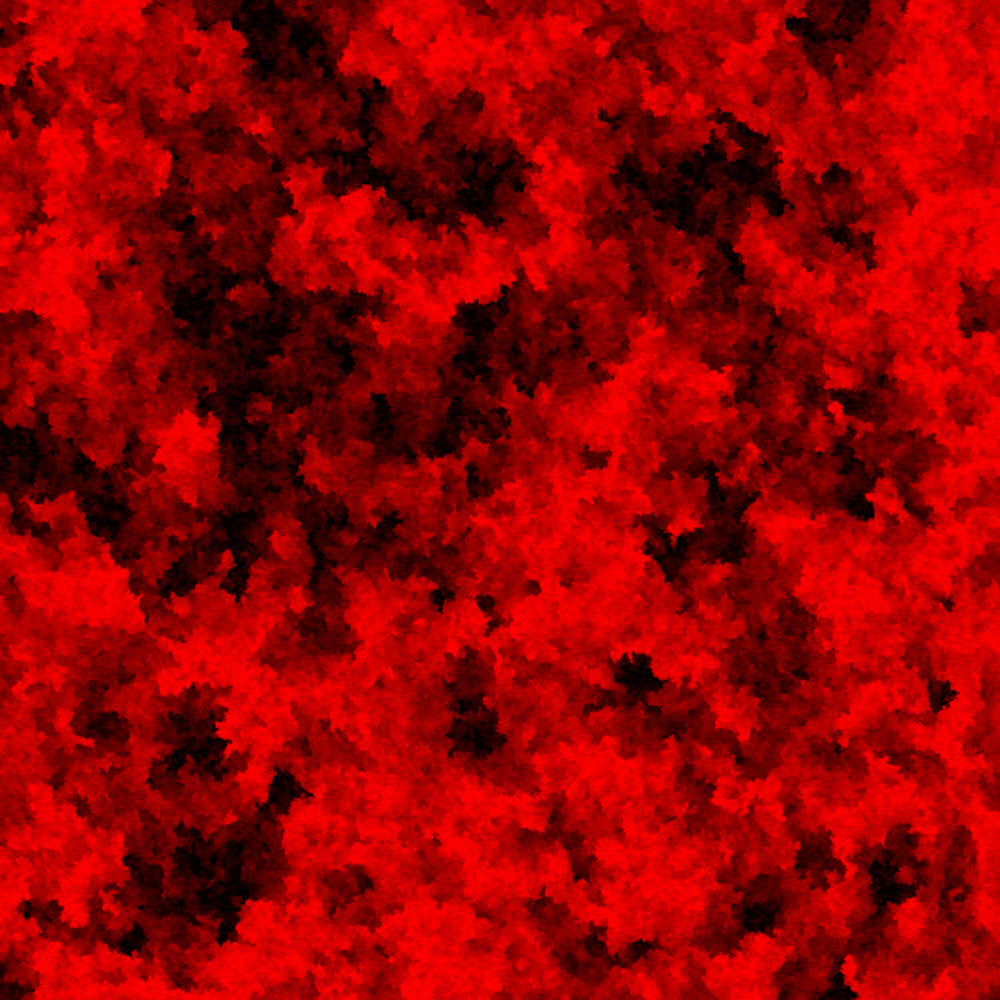
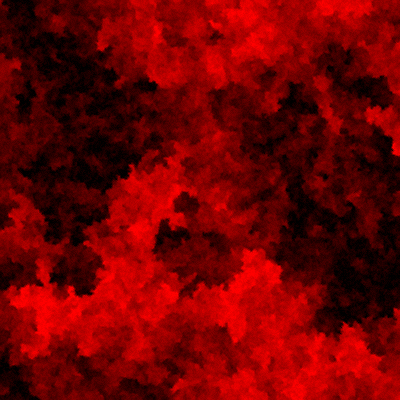
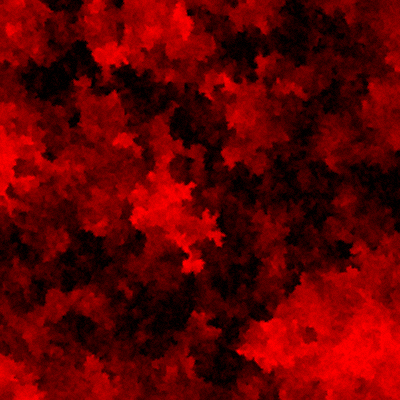
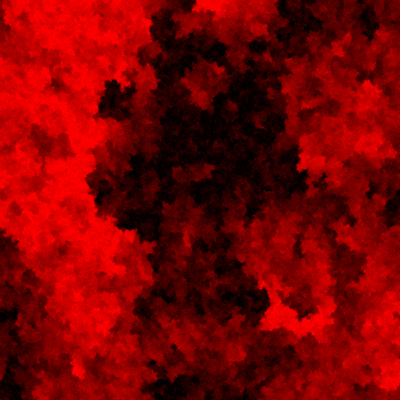
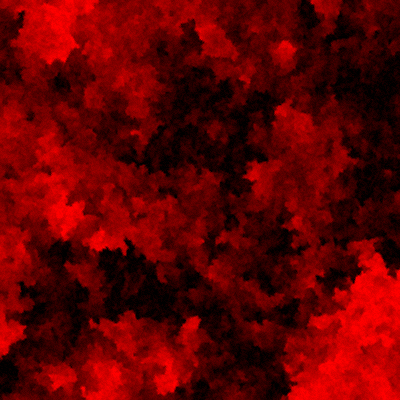

As always, my code is open source, so you can find it on my github.
Thanks for reading!

